Marketing & Sales
From maps to meaning: turning geographical data into actionable business intelligence
Through unified data integration and smart visualization, we achieved significant efficiency gains while dramatically reducing mapping errors.

To protect confidentiality, we may alter specific details while preserving the accuracy of our core contribution.
Context & objectives
Our client, a public regulator, oversees fair access to essential services for a large number of geographic areas, such as retail, public transport, and industrial zones nationwide. They faced a major challenge: making sense of complex geographical data to drive strategic decisions.
Their raw data was scattered across different systems and formats, from coverage maps to location points, making it hard to extract actionable insights. What they needed was a simple way to turn this technical data into clear insights that could guide policy decisions.
The client’s goals were clear:
Integrate and process geographical data from diverse formats (coverage maps, points, polygons, etc.)
Extract precise information about key amenities and infrastructure
Ensure the highest level of reliability
Enable fast and informed decision-making with intuitive visualizations
Approach
Drawing on our expertise in geographical information systems (GIS) and business intelligence, we designed a solution that bridges the gap between raw geospatial data and actionable business insights.
🛠️ Unified data integration
We consolidated all geographical data sources into a single, robust asset. This involved harmonizing:
coverage maps,
point locations of amenities,
and complex polygons representing service areas and demographic boundaries.
Our advanced data cleaning and transformation routines ensured consistency and reliability across all datasets – including the conversion of data from legacy cadastral systems to the latest cadastral base.
📁 Reliable amenity extraction
Next, we built algorithms to accurately identify and extract amenities such as retail stores, train stations, and industrial zones based on open-data. By leveraging external data sources, we were able to assess the reliability of the extraction made and find alternatives if needed.
📊 Business-friendly visualization
Finally, we translated this complex geographical data into clear, interactive dashboards using Power BI. These visualizations allowed decision makers to explore coverage gaps, amenity distribution, and demographic trends at a glance.
Custom filters and drill-down capabilities empowered users to answer their own questions without requiring technical support – turning data into a daily asset for strategic decision-making.
Results
The institution had transformed its approach to geographical data:
Enhanced efficiency: automated data integration and processing reduced manual workload by over 60%, which was also an error-prone stage in the process
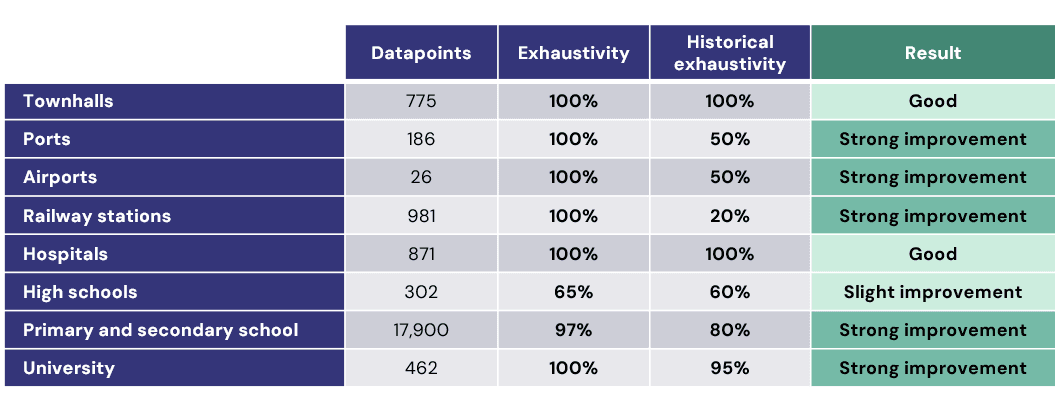
Precise amenity mapping: the institution’s reporting accuracy improved dramatically, with error rates in amenity mapping dropping by more than 80%.
Actionable insights: decision makers could now instantly visualize and understand the distribution of key amenities, identify service gaps, and prioritize interventions.
To safeguard confidentiality, we may modify certain details within our case studies.